I should begin by explaining that I am going to use new (old) terms here that may be bothersome to some, so let me explain. This posting is about developing new metrics that may be useful in understanding the social networking world where individuals contribute content. This would include tags on flickr photos, or descriptions of delicious bookmarks, etc. The contributors of this information will be referred to as Users and that should not be a problem for most. Further, for consistency with other semantic web efforts the various information objects that are the subject of our efforts are defined as Resources. The information that is associated with a resource is defined most broadly as an Annotation. Some use the term tag, but a tag is only one forma of annotation and the study of annotations precedes the web and provides some rich history to guide the investigation.
In developing metrics for Annotations, it may be useful to look at similar metrics that have been used in other situations. In information retrieval and text mining, term weighting is often used to establish the ranking or relevance of documents. Term weighting is computed from two factors: term frequency and inverse document frequency. Most simply put, term frequency is a normalized value calculated as the number of times a given term occurs in a document divided by the number of words in the document. Thus the term frequency of termi in documentj is calculated as:
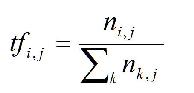
The denominator is the sum of the occurrences of all terms in documentj.
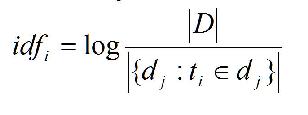
The inverse document frequency is the log of the number of documents in the corpus divided by the number of documents that contain the term:
Keep in mind that we are looking at TF-IDF as a model for thinking about new metrics. Thus it is helpful to review the model at the highest level. In the case of documents or document entities, we observed that a document may be envisioned as an entity that is attributed with the counts of the terms that exist in the document. In other words, a document is a tuple whose attributes are the counts of the terms. Over a collection of documents, we can assess the frequency with which a term occurred in a document and the extent to which the term was found in the documents in the collection. The formulas described above were developed to provide a quantification of these values. The resulting product of the two measures provides an indication of the degree to which a given document is “important” related to a given term.
This leads us to ask what new metrics we might use for environments such as social networking sites where we shift from documents as first class entities to Users as first class entities. As is the case for TF-IDF, we will look both at the entities and their attributes and at the collections as a whole. At the core, we know that we will have at least three things that may be related, and there may be more. The three universal objects are:
These three entities may be primitive or attributed. In the case that the Resource, Annotation, or User entities contain no useful information, we consider them primitive. To the extent that further information may be obtained directly or indirectly, we consider them attributed. In general, one or more of these entities are attributed. As primitives, consider that a URL (representing a resource) of the form:
http://136.142.116.1/access?id=12345
or a user-id (representing a user) of the form:
1234567
or an annotation-id (representing an annotation) of the form:
1
Assuming that a DNS lookup on the IP address provides no information, from just this information it would be hard to ascertain any information about these entities. On the other hand, the following entities would appear to provide some attribute information:
http://www.sis.pitt.edu/index.html
Michael_B_Spring
Address
We may infer with some confidence that the URL is within the edu domain and that the resource is an html page. We could infer, with less certainly, that Michael B. Spring is the name of the user and that the annotation refers to an address. Finally, we might find these entities as tuples of known data such as:
http://www.sis.pitt.edu/index.html, main page, school of information Science, University of Pittsburgh
Michael B. Spring, Associate Professor, School of Information Sciences, University of Pittsburgh
Address, office, vcard format, xxx,xxx,xxx
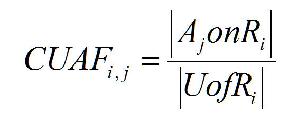
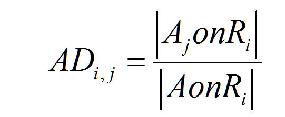
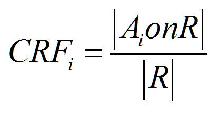
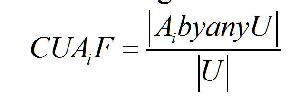
In this case, we have a much richer set of attributed objects. Some simple metrics with beginning formalisms Given primitive or attributed objects, what are the metrics that might be of use? We can begin with the most obvious. Imagine that any given Resource(R) has a series of Users(U) provided Annotations(A) associated with it. This might be the case for flickr and is even more so the case for delicious. We begin very simply with a couple of observations.
On the surface, all of these metrics, which mimic some of the things done by TF or IDF appear to provide some meaningful kind of metric, but as they are exercised against data, they begin to pale as meaningful measures. What we need to do is look more carefully at the simple semantics behind the calculations.
After several discussions with PhD Students on the formalisms put forward above and several dozen other variations, we were forced again and again to try to more clearly ask what it was we are trying to uncover or discover. This leads to the following preliminary discussion on the semantics of Annotation analysis.
Let’s ask simply what term frequency means conceptually; we will try to avoid formulas and speak simply about the semantics. If we have a termi and a set of documents, it will be true that the termi will occur some number of times (including zero) in each documentj. A term could appear 5 times in a very long document and 5 times in a very short document. We need to account for this as it makes sense that this would make a difference. So, rather than use the count, we can use the percent of the document made up of these terms. In general, we would not expect any term to make up 100% of a document or even a majority of the terms in a document. We might expect the percentages to be very low. Never the less, a higher percentage would suggest that a document was more related to the term.
Now let’s turn to Annotations. In a simple scenario, we might imagine that if 100 Users assigned an Annotation to a Resourcej, and if each User used only one Annotation, and if all of the Annotations were identical, that Annotationi would likely be a descriptor of Resourcej. (If each of a hundred Users used a different Annotation for Resourcej we would not be moved to suggest that any particular annotation was a good descriptor. Thus, Annotation Frequency is not the same as Term Frequency. In the ideal situation, unanimity about a singular tag would likely provide a good description. But things are never this simple. We have at least two dimensions on which Annotations related to a Resource might vary. First, it might be the case that only some Users who Annotate a resource used a particular Annotation. Second, it might be the case that Users provide more than one Annotation for a Resource. The situation is also complicated by the fact that User Annotations are generally weighted flatly. That is, a user may not use a term more than once or assign it an explicit weight. Some have suggested that Annotation order is an implicit indicator of importance, but other research has questioned this assumption. More insidious yet, many systems provide recommended Annotations, based on existing Annotations, which may induce a bias based upon early Annotations. Thus developing a good metric for the importance of a given Annotation is not as simple as Term Frequency. Consider a couple approaches to measuring Annotation descriptiveness.
In the first approach, we take the count of a given Annotation and divide it by the count of all of the Annotations that have been applied to the resource. Let’s consider three situations. S1: If there is perfect unanimity using singular Annotation, the result will be one. S2: If 10% of the users used the Annotation and 90% used some other Annotation, the result would be .1. S3: If 100% of the users used the Annotation, but they also used 9 other Annotationss, the result would be .1. This appears to be a little less than we might hope for. As an intuitive level, it would appear that the metric should yield a higher value in S3 than in S2.
A better approach might be to measure the use of Annotations by each User, and average those uses. Again, we begin by considering three situations. S1: If 100% of the Users used one Annotation, and that Annotation is the target Annotation, each user would have a ratio of 1, and the average would be one. S2: If 10% used the Annotation, their individual measures would be 1; the 90% that used some other tag would have usages of zero. The average would be .1. S3: If 100% of the users used the tag, but they also used 9 other tags, the average would still be .1. This doesn’t seem to get us very much related to S2 and S3. On the other hand, consider S4: where 90% of the users used one tag and 10% used 10 tags. The first approach would yield a value .5 while the second approach would yield a value of .91.
One final approach, potentially becoming too complex, would be to find a way to weight the terms so as to differentiate S2 and S3 without having a negative impact on the measures developed for S1 and S4. Consider a system that weights each Annotation based on its penetration. For example, imagine an Annotation-Weight that is equal to the number of times an Annotation is used by the Users who Annotated a Resource divided by the number of Users. We build on approach two. Let’s look at the four situations. S1: If 100% of the Users used one Annotation, and that Annotation is the target Annotation, each user would still have a ratio of 1, and the average would be one. S2: If 10% used the Annotation, their individual measures would still be .1; the 90% that used some other tag would have usages of zero. The average would now be .01, because the weighted value of the annotation would drop from 1 to .1. S3: If 100% of the users used the tag, but they also used 9 other tags, the average would still be .1. This does seem to get us somewhere related to S2 and S3. S4: if 90% of the users used one tag and 10% used 10 tags, the second approach yielded a value of .91. Under this new metric, it would yield a value nearer to .81, which would also seem more reasonable.
There are the other scenarios that we might imagine that are descriptive of User Annotation that indicates good and bad Annotations that describe resources? Using some of these simple scenarios, we might be able to cobble together a semantic conceptualization of what is good and what is bad. Above, I have suggested some preliminary steps in this analysis which seem to provide some differentiation. This needs to be taken several steps further. If we can accomplish this goal for “Annotation Frequency”, we can turn to the thornier question of whether there is a companion measure (equivalent to IDF) that provides additional refinement of the value of a Annotation in distinguishing relevant resources from non-relevant resources.
In closing this preliminary discussion, let me list some of the issues that any metrics will eventually need to take into account:
There are other considerations I am sure, but this piece has already extended well beyond what I had planned. It is clear from this exploration, at least to me, that there is some room to explore possible metrics which might be experimentally verified or debunked.